Python for Network Reverse Power Flow (PyNRPF)
Some substations record only the power magnitude, not the direction.
Reverse power flow readings, which record electricity flowing from households back to the grid due to solar, look normal and pass the usual checks like missing data and outliers. However, they have the wrong sign and should have been read as negative. PyNRPF finds them and puts the sign right.
The problem
When solar exports are read by electricity meters as imports
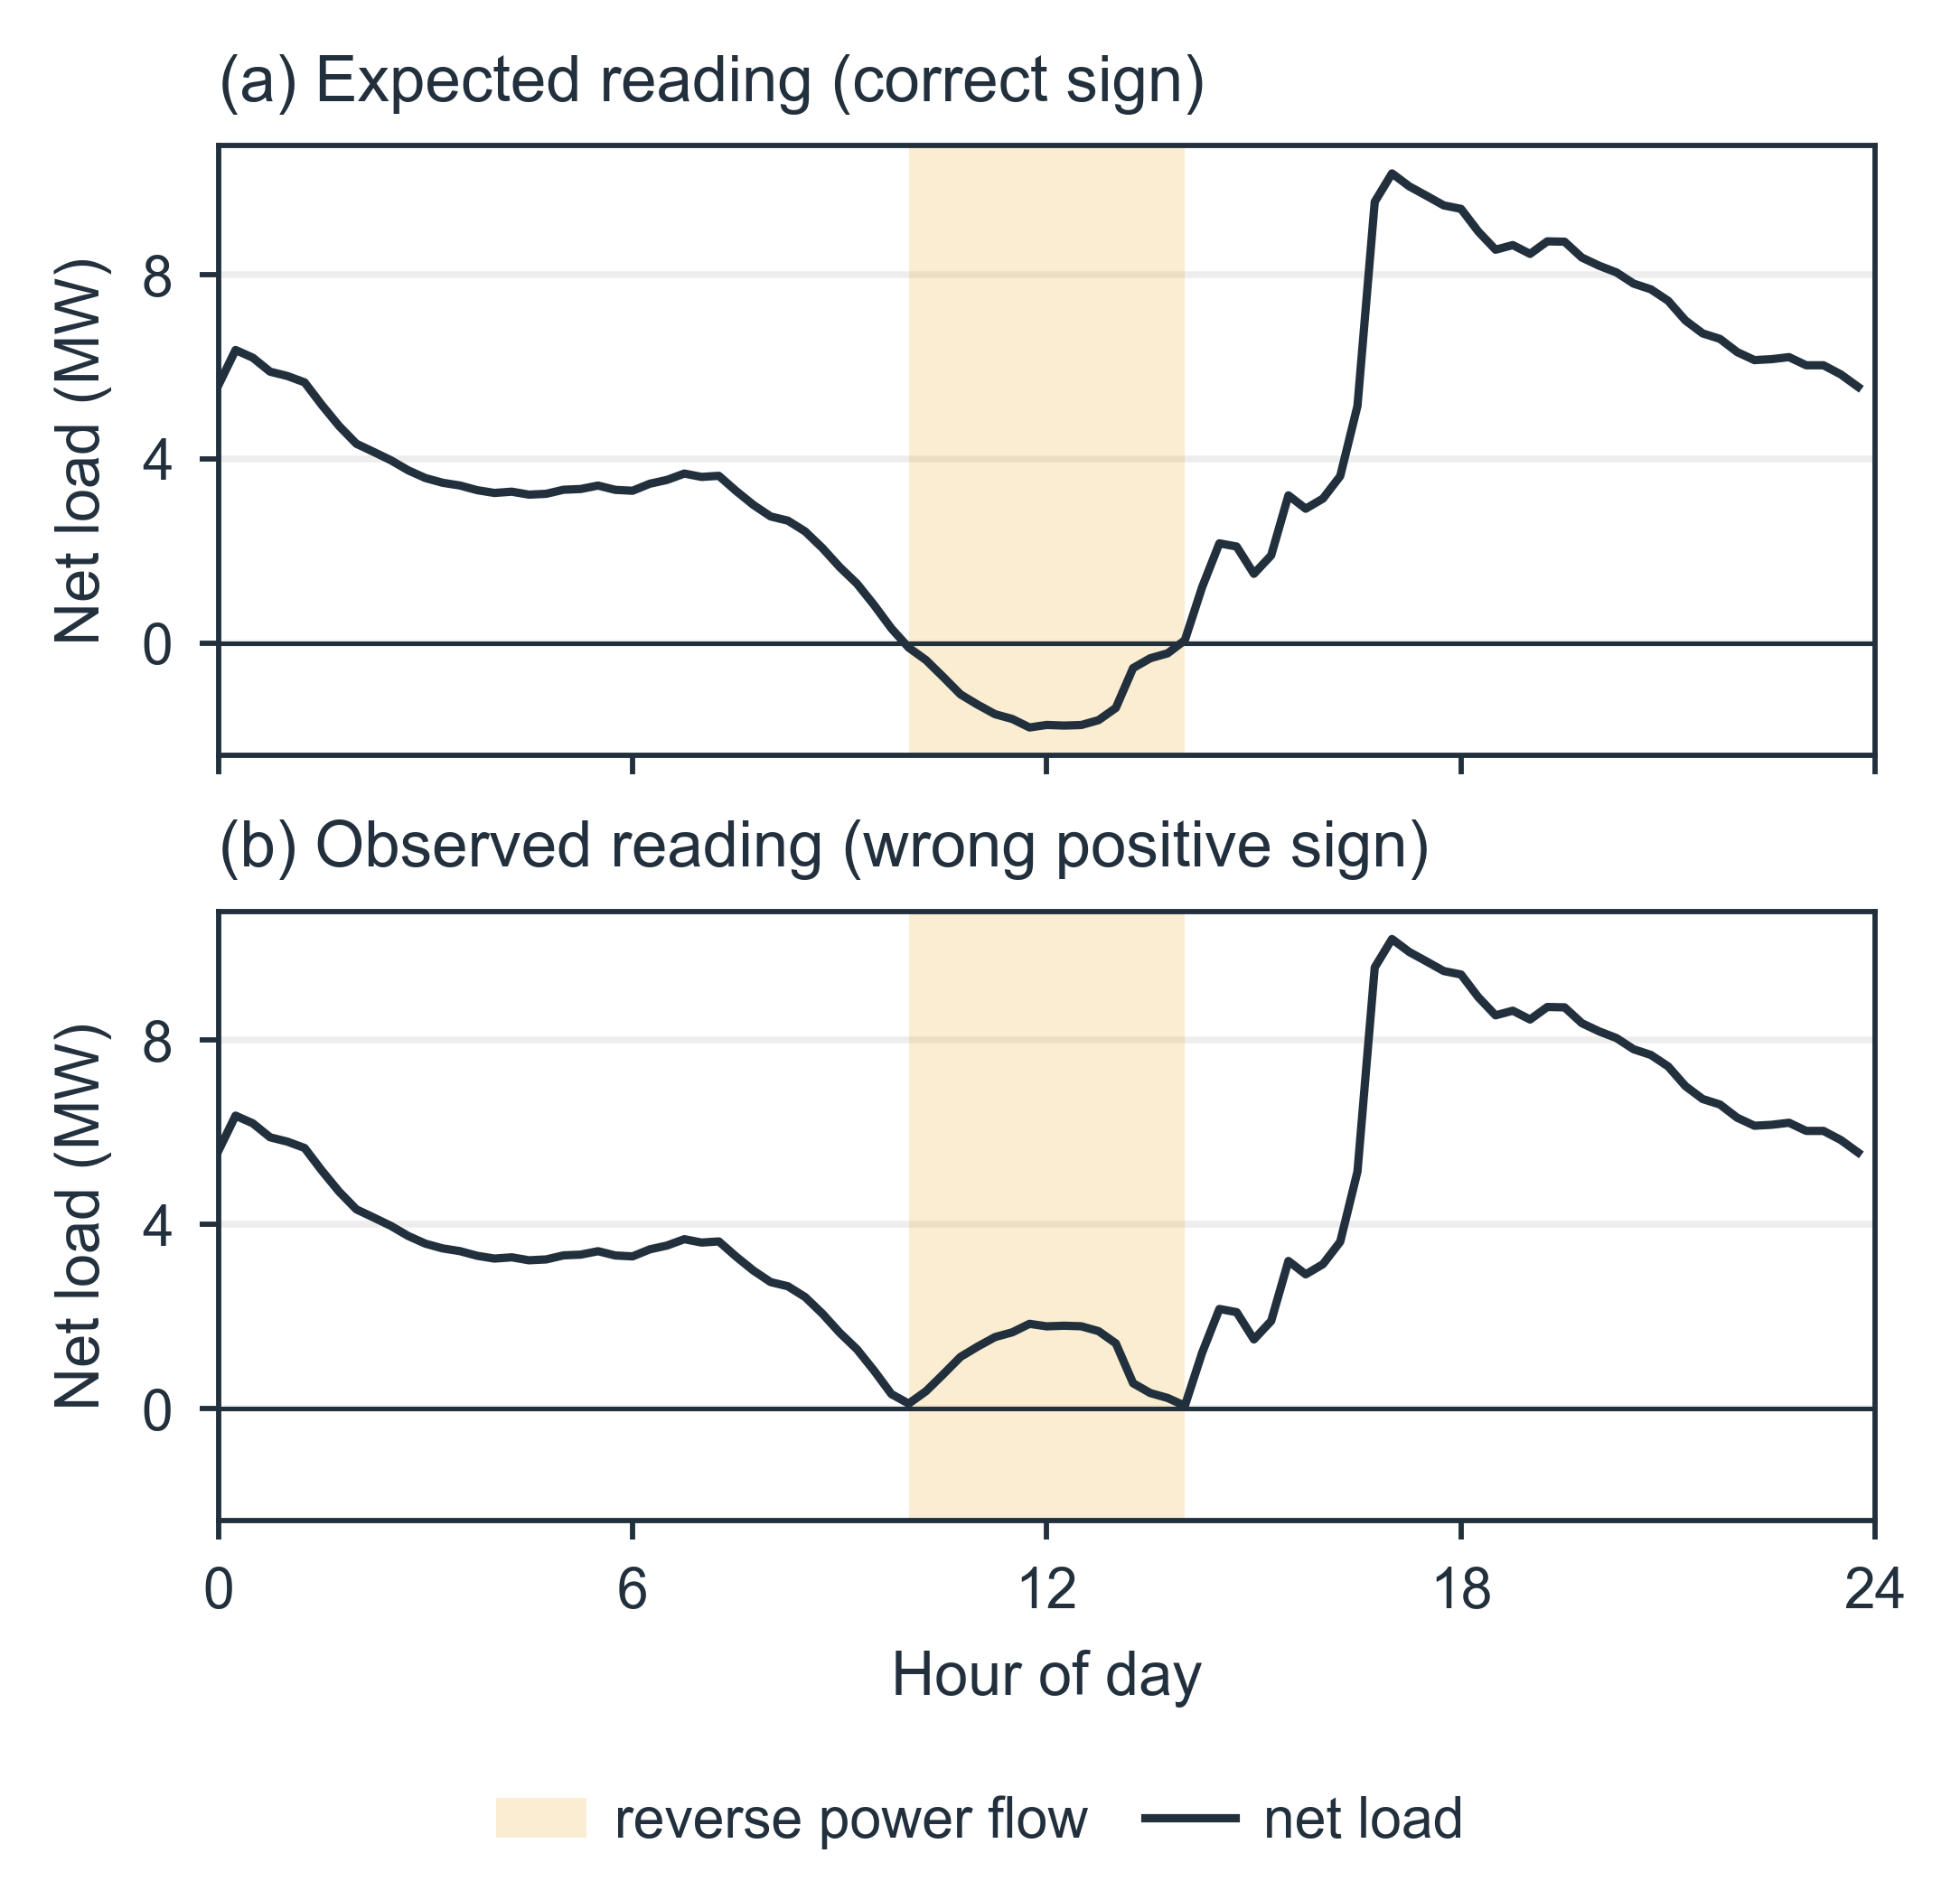
On a sunny, mild day, rooftop solar can produce more electricity than the homes and businesses around a substation use. The surplus flows back into the network. This is called reverse power flow, and a correct meter records it as negative: the day's trace dips below zero around midday.
Many older substation meters measure only how much power flows, not which way. They store the export as an import, so the trace touches zero and bounces back up instead of crossing it. Nothing looks broken, yet every one of those readings is wrong by twice its value.
Key facts
A growing problem, hiding in plain sight
Ausgrid figures from the 2023 case study in the AUPEC 2026 paper, found with the earlier methods described there.
Why it matters
A small sign with large consequences
Reporting
Network businesses report historical demand to regulators, and those figures carry the error too.
Forecasting
Net-load forecasts learn from history. Trained on wrong signs, they learn the wrong shape of a sunny day.
Network planning and investment decisions
Networks rely on net-load forecasts for network planning, which informs their infrastructure investment decisions. Hidden exports make minimum demand look higher than it really is.
Upgrading the meters fixes future readings, but not the years of history already recorded. That history needs correcting.
Not one network's problem
The limitation dates from equipment installed before rooftop solar was common, when power was expected to flow only from the grid to customers. The same metering limitation has been reported at Energy Queensland[3] and SA Power Networks[4], and a similar meter behaviour was documented in the United Kingdom[5].
How it works
One physical idea, three possible decisions
Look at each day on its own
PyNRPF reads one substation's fifteen-minute readings for one day, together with an estimate of how much solar the area generated.
Test a flip
It tries every midday window and asks: if the sign were flipped here, would the underlying demand join up smoothly with the hours either side? Real demand changes smoothly; a wrong sign leaves a tell-tale bump.
Weigh the evidence
The stronger the case for a flip, the higher the probability that the day was recorded wrongly.
Correct automatically
Clear evidence of a wrong sign: the readings in the window are flipped.
Ask a person
Not sure either way: the day goes to a reviewer, with the window PyNRPF suggests.
Keep as recorded
No sign of an error: the day stays exactly as it was.
One setting decides how sure PyNRPF must be before it acts on its own, and so how many days go to a person.
Built for practice
Made to run inside a network's data pipeline
Original data untouched
Corrections are written alongside the recorded readings, which are never overwritten.
Traceable
Every result records the software version and settings that produced it, so it can be reproduced exactly.
Runs where the data lives
A Python package that works on a laptop or across a cluster, one substation at a time.
No training needed
It works out of the box, and a few reviewed days are enough to tune it to a new network.
Research
Grounded in peer-reviewed work
PyNRPF grows out of a PhD study at UNSW Sydney in partnership with Ausgrid. A conference paper accepted for AUPEC 2026 identifies the problem and tests two earlier methods on the Ausgrid network[2]. The current method is the subject of a journal article in preparation.
The team
Who made it
UNSW Sydney
M. Syahman Samhan, Anna Bruce and Baran Yildiz, School of Photovoltaic and Renewable Energy Engineering
Ausgrid
Jaysson Guerrero Orbe, Navid Haghdadi and Daniel Sim, Demand Forecasting
PyNRPF is part of M. Syahman Samhan's PhD study, supported by the University International Postgraduate Award (UIPA) from UNSW and top-up scholarships from Ausgrid, RACE for 2030 and the NSW Decarbonisation Innovation Hub. It is open source under the MIT licence.
References
- IEA Photovoltaic Power Systems Programme, "Australia: 2025 country update." https://iea-pvps.org/about-iea-pvps/members/australia/
- M. S. Samhan, J. Guerrero Orbe, N. Haghdadi, D. Sim, A. Bruce and B. Yildiz, "Reverse power flow sign correction for meter-limited substation data," accepted for the Australasian Universities Power Engineering Conference (AUPEC), November 2026.
- F. Geth, M. Vanin, W. Van Westering, T. Milford and A. Pandey, "Making distribution state estimation practical: challenges and opportunities," arXiv:2311.07021, 2023. https://arxiv.org/abs/2311.07021
- Australian Energy Market Operator, "South Australian under frequency load shedding, dynamic arming: implementation investigation," 2021. aemo.com.au
- Office of Gas and Electricity Markets, "Single phase import meters operating under export conditions, manufacturer poll: summary of responses received December 2003," 2003. ofgem.gov.uk